

Data Analyst Skills for CV
What to List (2026)
Data analyst CVs need to show your technical toolkit clearly. Employers want to know which query languages you use, which visualization tools you build dashboards in, and whether you can communicate findings to non-technical stakeholders. Listing analytical skills without specifics tells them nothing.
The demand for data analysts continues to grow, but so does the competition. Your CV needs to clearly differentiate between basic spreadsheet skills and genuine analytical capabilities. Advanced Excel is not the same as Python data analysis, and recruiters know the difference.
The skills below cover what data teams and hiring managers look for when reviewing analyst applications in 2026.
Top 10 Data Analyst Skills Employers Look For
Example: How These Skills Look on a Real CV
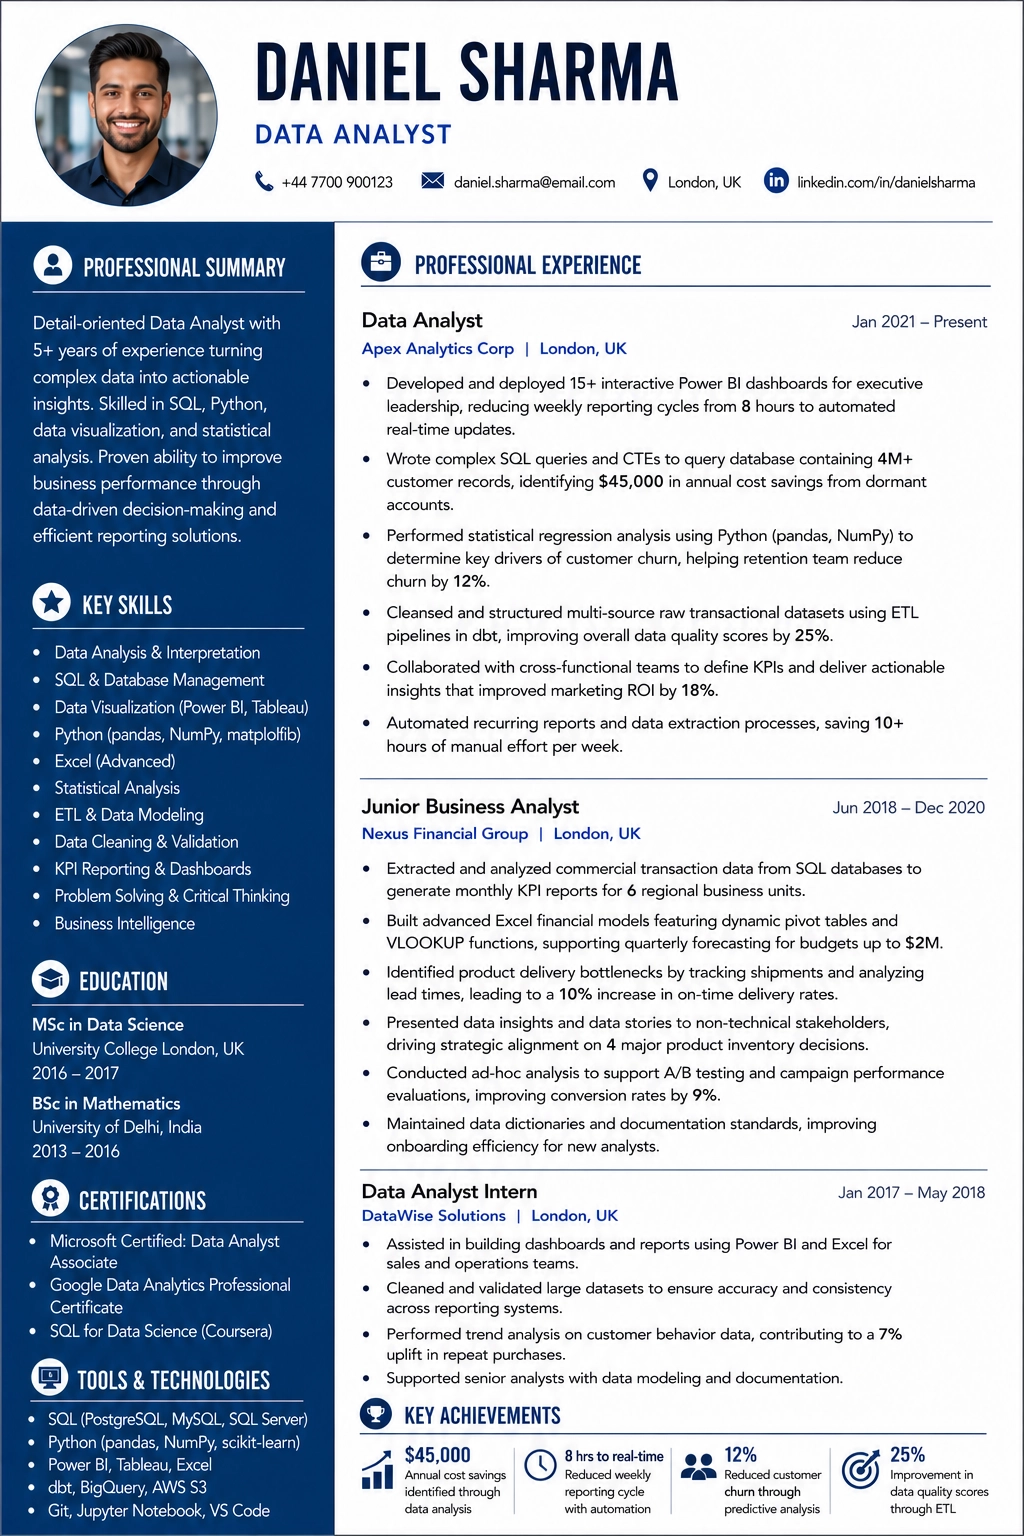
Listing skills is important, but showing how you used them in real work experience is what gets you interviews. Here is how a strong Data Analyst CV presents these skills.
Data Analyst
Apex Analytics Corp
- •Developed and deployed 15+ interactive Power BI dashboards for executive leadership, reducing weekly reporting cycles from 8 hours to automated real-time updates
- •Wrote complex SQL queries and CTEs to query database containing 4M+ customer records, identifying $45,000 in annual cost savings from dormant accounts
- •Performed statistical regression analysis using Python (pandas, NumPy) to determine key drivers of customer churn, helping retention team reduce churn by 12%
- •Cleansed and structured multi-source raw transactional datasets using ETL pipelines in dbt, improving overall data quality scores by 25%
Junior Business Analyst
Nexus Financial Group
- •Extracted and analyzed commercial transaction data from SQL databases to generate monthly KPI reports for 6 regional business units
- •Built advanced Excel financial models featuring dynamic pivot tables and VLOOKUP functions, supporting quarterly forecasting for budgets up to $2M
- •Identified product delivery bottlenecks by tracking shipments and analyzing lead times, leading to a 10% increase in on-time delivery rates
- •Presented data insights and data stories to non-technical stakeholders, driving strategic alignment on 4 major product inventory decisions
Complete Data Analyst Skills List
Common ATS Keywords for Data Analyst
Applicant Tracking Systems scan your CV for specific keywords before a human ever reads it. Make sure these terms appear naturally in your skills section and work experience.
Data Analyst Skills Explained in Detail
Understanding what each skill really means helps you describe it accurately on your CV and discuss it confidently in interviews.
SQL Data Querying and Manipulation
SQL is the foundational query language used to extract, filter, and manipulate data stored within relational database management systems. Data analysts write complex queries employing JOINs, subqueries, and common table expressions to aggregate raw information from multiple tables. They must optimize their SQL scripts to ensure queries run efficiently, particularly when working with databases holding millions of records. Acquiring this technical competency allows analysts to retrieve the exact datasets needed to answer business questions without relying on pre-formatted reports.
Beyond data retrieval, SQL enables analysts to perform initial data transformations and preliminary calculations directly on the database server. They use window functions and conditional statements to create computed columns, calculate running totals, and segment customer cohorts. Understanding database indexing, schemas, and primary-foreign key relationships is crucial for maintaining data integrity during querying. The ability to manipulate database structures independently ensures that analysts can prepare clean datasets for downstream visualization and statistical analysis.
Data Visualization and Dashboard Design
Data visualization is the art of translating raw numbers and complex analyses into intuitive visual formats that stakeholders can easily comprehend. Using tools like Power BI, Tableau, or Google Looker Studio, analysts build interactive dashboards that display key performance indicators in real time. They select the most effective chart types to illustrate trends, distributions, and correlations, avoiding visual clutter that might distract from the main message. A well-designed dashboard acts as a single source of truth, enabling managers to monitor operational health and identify emerging issues quickly.
Effective dashboard design requires a deep understanding of user experience and business needs. Analysts must interview stakeholders to determine what decisions the dashboard will support and structure the visual hierarchy accordingly. This includes incorporating drill-down options, interactive filters, and clear labels that allow users to explore the data independently. By combining technical tool expertise with visual communication principles, analysts convert static spreadsheets into dynamic tools that drive business decisions.
Python and R Data Analysis
Programming languages like Python and R extend a data analyst's capabilities far beyond the limits of standard spreadsheet software. Python, with its specialized libraries such as pandas and NumPy, allows for the efficient manipulation, cleaning, and statistical processing of extremely large datasets. R is favored for its advanced statistical modeling capabilities and rich visualization packages. Automating repetitive data tasks through scripts reduces human error and frees up time for deeper exploratory analysis. Mastering these languages enables analysts to perform sophisticated forecasting and predictive modeling.
The use of Jupyter Notebooks or RStudio environments allows analysts to document their coding workflow, mathematical formulas, and visual outputs in a single, shareable document. This reproducibility is essential for peer reviews, collaborative coding, and maintaining analytical rigor within a team. Analysts leverage these programming environments to perform hypothesis testing, build linear regressions, and prepare data for machine learning applications. Demonstrating proficiency in Python or R signals to employers that you can tackle complex, unstructured data challenges that traditional tools cannot resolve.
Skills to Avoid on a Data Analyst CV
These generic terms appear on nearly every CV. They tell the recruiter nothing specific about your abilities and will not help you pass an ATS filter.
How to Present These Skills on Your CV
Create a Technical Skills section listing: Languages (SQL, Python), Tools (Tableau, Power BI, Excel), Databases (PostgreSQL, BigQuery), and Platforms (Google Analytics, Looker).
In your experience, describe the business impact of your analysis: identified cost savings, improved conversion rates, or informed strategic decisions.
Include links to your portfolio, GitHub, or Kaggle profile if you have public data projects.
Mention the data volumes you work with. Analyzing 100 records is different from working with millions of rows.
Frequently Asked Questions
Do I need to know Python for data analysis?
Not always for entry-level roles. SQL and Excel are often sufficient for junior positions. However, Python or R skills open the door to more advanced roles and significantly increase your market value.
Should I list Kaggle projects on my CV?
Yes, if they are relevant and well-executed. Kaggle competitions and personal data projects demonstrate practical skills. Include links and briefly describe the project and your approach.
How do I show data skills from a non-analyst role?
Many roles involve informal data analysis. If you created reports, tracked KPIs, built spreadsheets, or made data-informed decisions in a previous role, describe those activities using data analyst terminology.
Is a statistics degree required?
No. While a quantitative degree helps, many successful data analysts come from business, economics, or self-taught backgrounds. Focus on demonstrating your skills through projects and certifications rather than worrying about your degree title.
Build Your CV Free
Ready to build your CV with a properly structured skills section? Our free CV builder helps you create a professional, ATS-friendly CV with no login, no watermarks, and instant PDF download.
Related Skills Guides
CV Toolkit
Build Your Professional CV for Free
Pick from 30+ recruiter-approved designs and start applying in minutes. 100% Free.
Cover Letter Maker
Professional matching correspondence. Build for Free.
Business Card Maker
Sleek, modern designs for authority branding. 100% Free.
100% Free • No Credit Card • No Watermarks • Instant Access